
Highlights
Where have all the children gone? Ask one parent in Houston and another in Los Angeles, and you will get very different answers—not just about how many children there are, but about where in each city you will find them.
New data let us see this geography for the first time at the scale of a single neighborhood. To do this, I combined the Census Bureau’s Gridded Environmental Impact Frame, which counts residents by age and sex in cells of roughly one square kilometer every year since 2000, with CoreLogic records on nearly every home in the country.1 For each neighborhood, I computed its Youth-to-Woman Ratio (YWR): the number of children under 18 per working-age woman. It is a simple measure of how many children live in a particular area.2
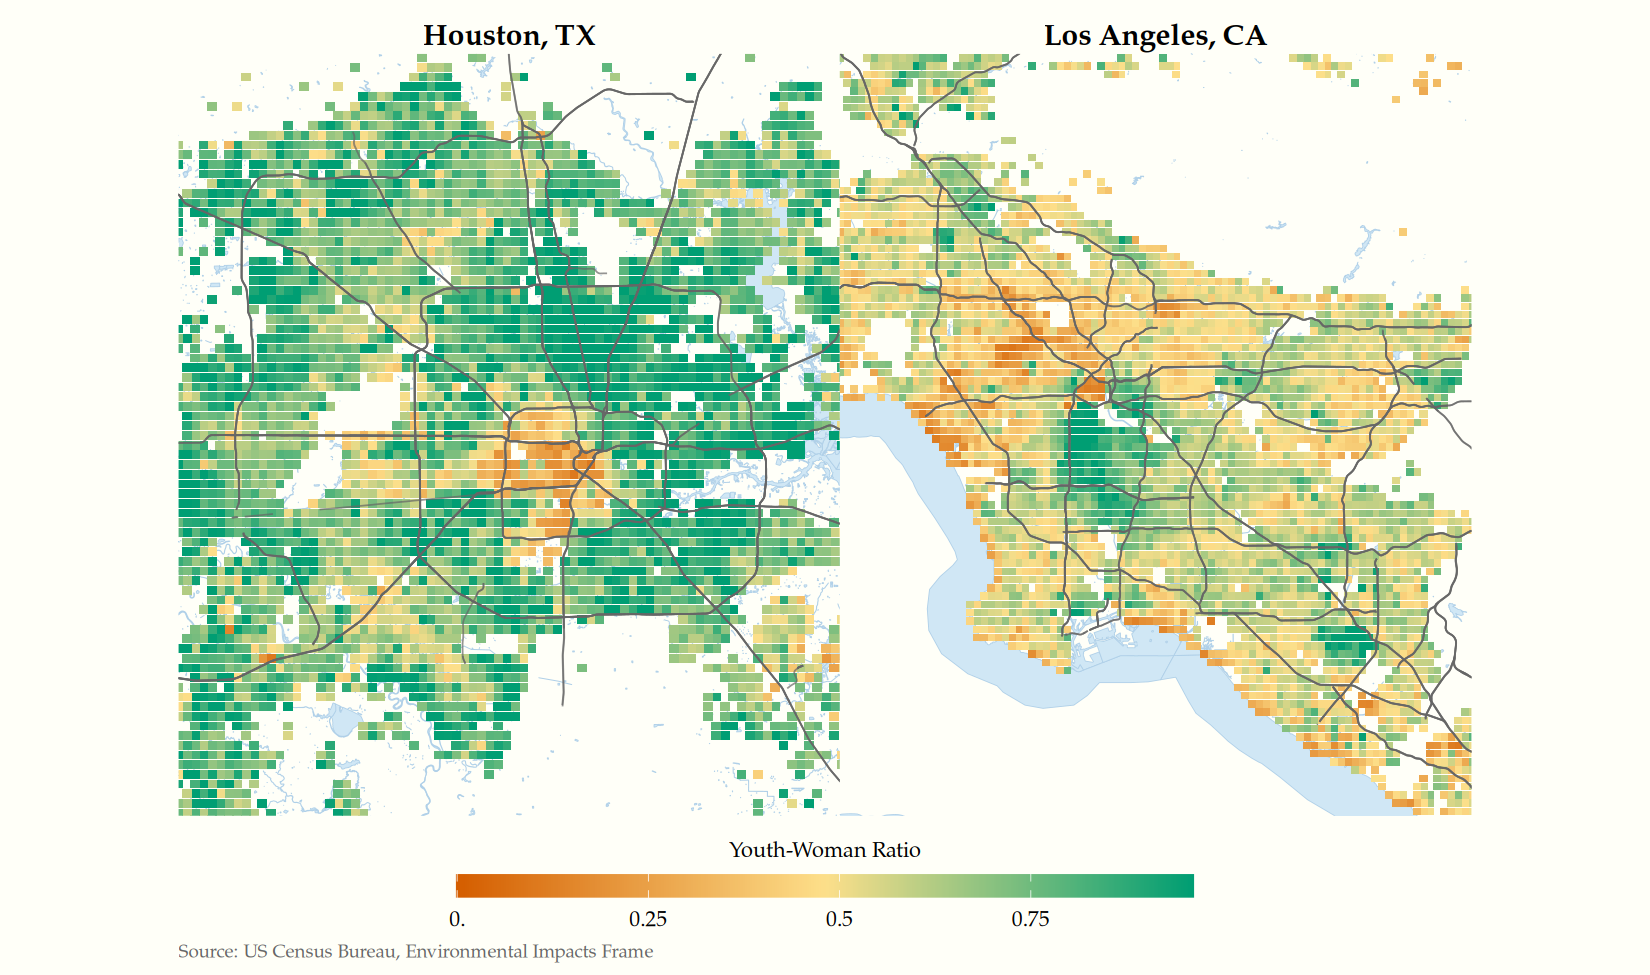
The figure below plots the YWR for Houston and Los Angeles on the same color scale. Green cells have more children; orang cells have fewer. The contrast is stark.
Houston is green nearly to its core, with family-heavy neighborhoods sitting close to downtown. Los Angeles is mostly orange and tan, its children pushed into a handful of pockets. These are both sprawling Sun Belt-ish metros of similar physical extent, yet one is visibly a place that raises children and the other, increasingly, is not.3
Neighborhoods Have a Lifecycle
Behind these snapshots is a process that plays out almost everywhere. A new subdivision goes up on the edge of a city and fills with young families. For a couple of decades it teems with children. Then the original cohort grows up and moves out, and unless new families replace them, the neighborhood quietly empties of kids even as its houses stay full of the parents who raised them.
You can see this lifecycle written into the housing stock.
The figure below plots each neighborhood’s YWR against the average age of its homes, with one curve for 2000 and one for 2020. In 2000, the relationship was a pronounced hump: neighborhoods whose homes averaged about 25 years old—built in the suburban boom of the 1970s—brimmed with children, while both newer and much older neighborhoods had fewer. This is the cohort effect in cross-section. By 2000, homes built in the 1970s were filled with families whose children were still at home.4
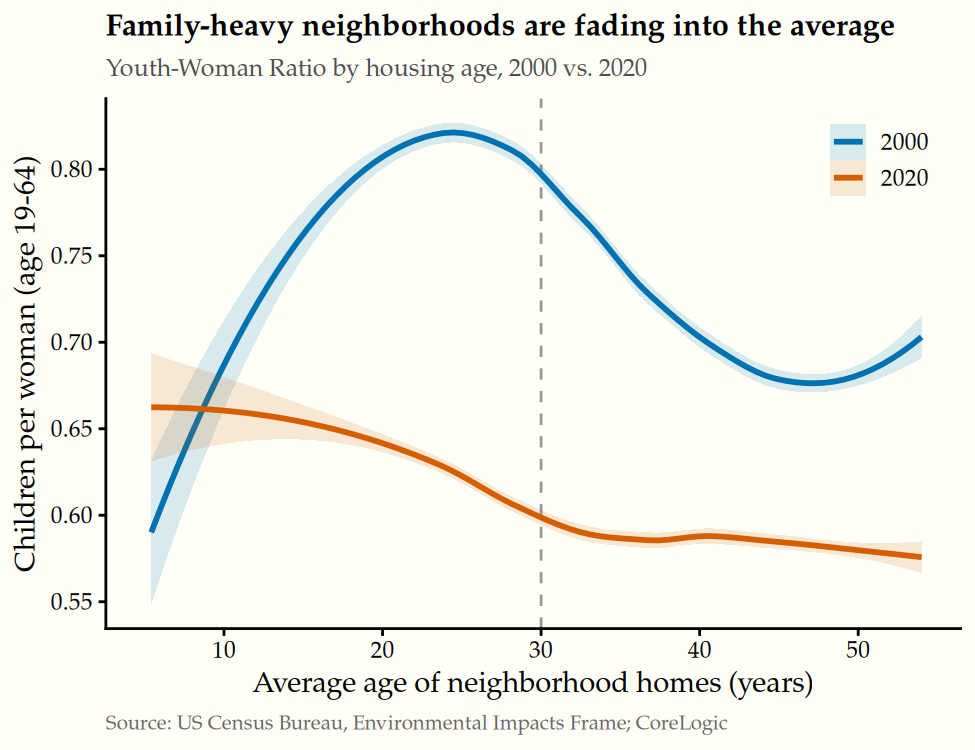
By 2020, that hump had all but vanished. The gap in child density between the most and least family-heavy vintages roughly halved, and the peak collapsed by about 70 percent.
Two forces are at work. One is a secular, nationwide decline in the YWR that pulls the whole curve down. The other—the more interesting one—is convergence: America’s neighborhoods are becoming more alike in their age structure. The places that were once distinctively full of children are reverting to the average.
Some Neighborhoods Bounce Back. Some Don’t.
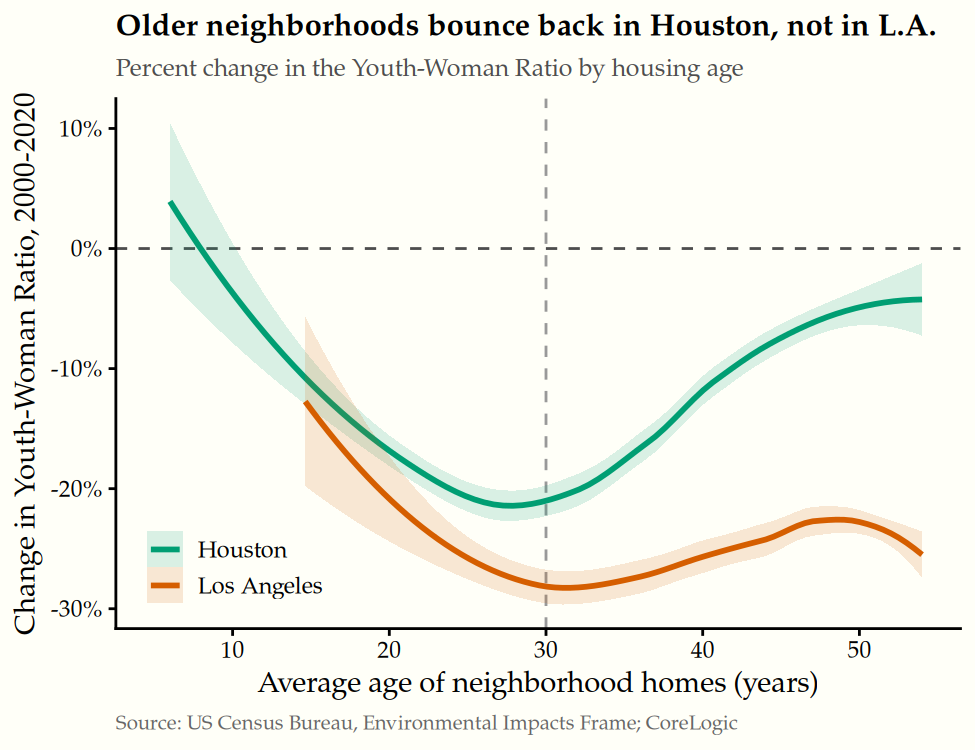
Convergence is an average, and averages hide the most telling variation. To see it, we must not look at levels but at change: how much each neighborhood’s YWR rose or fell between 2000 and 2020, again by the age of its homes.
Here the lifecycle is unmistakable, and so is the divergence. In both Houston and Los Angeles, the steepest declines hit middle-aged neighborhoods whose homes are around 30 years old—exactly the cohort that filled with families in the 1990s and emptied as those children left for good. But at the old end of the housing stock, the two cities part ways. Houston’s oldest neighborhoods barely declined and rebounded in places, recovering to within a few percent of their 2000 child density, as a new generation of families moved in. Meanwhile, Los Angeles’s oldest neighborhoods kept declining, losing roughly a quarter of their children over 20 years. The same houses that turn over to young families in Texas stay locked in place in California.5
An Explanation: Lock-in
Why would older neighborhoods rejuvenate in one metro and ossify in another? By itself, the descriptive pattern does not tell us. But it points to a clear and underappreciated suspect.
For an old neighborhood to welcome young families, its current owners have to sell. The barrier is that in expensive, high-appreciation metros, the tax code rewards aging homeowners for not selling.
Three policies in particular stand out. First, property-tax assessment caps—California’s Proposition 13 is the famous example—freeze a long-tenured owner’s tax bill far below what a new buyer would owe, so moving, even downsizing nearby, can raise your taxes. California softened this in 2020 by letting older owners carry their low assessment to a new home, but only one inside the state—so a senior who would follow their children to Texas or Arizona still forfeits it.
Second, the federal step-up basis erases a lifetime of capital gains if you die in the house rather than sell it, a bargain worth tens of thousands of dollars on a home bought decades ago in a pricey market.6
Third, senior property-tax exemptions often carry residency requirements that reset the clock when you move. Each of these incentives grows with home-price appreciation, which is precisely why they bite hardest in coastal metros and barely register in the fast-building, modestly-priced Sun Belt.
The national fingerprints of lock-in are visible even apart from my neighborhood maps. In a 2026 story for the Wall Street Journal, Nicole Friedman and Veronica Dagher report that in California, nearly 18% of property transfers now happen through inheritance—double the 8.8% national share—as owners hold appreciated homes until death. And, in a 2024 working paper, Joshua Coven and coauthors find that reducing the tax penalty on selling would raise homeownership among younger households by speeding turnover.
Finally, I want to be candid about what these maps can and cannot show. The cross-metro correlation between lock-in policies and demographic rebound is suggestive, not causal. Assessment caps, restrictive zoning, scarce construction, and rapid price growth all travel together, and disentangling them is a job for future research.7 What the data establish is the phenomenon: a common neighborhood lifecycle, a broad convergence in who lives where, and a sharp split in whether aging neighborhoods ever get a second generation.
What Might Help
If lock-in is even part of the story, several reforms would loosen it and let family-sized homes reach the families who need them:
-
Drop residency requirements from senior property-tax exemptions, so a senior can move without forfeiting accumulated benefits.
-
Make tax benefits portable, not place-bound. Where exemptions attach to the house rather than the owner—as under Proposition 13 before 2020—selling triggers a punishing reassessment. States should let owners carry a defined benefit to a new home, and should resist new assessment caps like Georgia’s recent HB 581 that recreate the same trap.8
-
Reform the step-up basis for primary residences—through carryover basis, deemed realization at death, or a cap—so the tax code stops paying people to die in houses too big for them.
Why the Neighborhood Lifecycle Matters
Family-sized housing in safe, high-opportunity neighborhoods is one of the binding constraints on family formation. For example, a 2026 working paper by Benjamin Couillard finds that adding large units generates more than twice the births per dollar of adding small ones, and Lyman Stone and Wendell Cox argue in their 2025 report for the Institute for Family Studies that the missing middle of family housing leads to missing children. When seniors are locked into homes their children have long since left, those homes never reach the next generation of parents, and the neighborhoods where today’s adults grew up are closed to their own kids.
Unlocking those homes would do more than house young families. Aging owners freed to downsize could also move closer to their children and grandchildren, easing the hands-on caregiving that flows in both directions across generations—grandparents minding grandchildren, adult children looking after aging parents—and lessening the public cost of institutional care.
The lifecycle I have traced is not demographic destiny. New families built these neighborhoods once; the question is whether policy will let them do it again.
Colin Williams is a PhD Candidate in Economics at the University of Virginia, where he studies housing policy and local public finance.
Editor's Note: The opinions expressed in this article are those of the author and do not necessarily represent the views, policies, or positions of the Institute for Family Studies.
1. The Gridded Environmental Impact Frame is built from administrative Census and IRS microdata and offers consistent ~0.01° spatial resolution over time, as documented by Voorheis and coauthors. I average it into five-year periods and merge it to CoreLogic parcel records (home age, size, bedrooms) snapshotted in 2023. The analysis covers twelve large metros and about 35,000 neighborhood cells with well-defined adult-female populations in both 2000 and 2020.
2. The YWR is not a pure fertility rate; it reflects births, mortality, and especially migration. It captures where families raise children, not only where they bear them — a family that moves to a good school district when its children reach school age shows up as high-YWR there, not where the children were born.
3. Notes: Average Youth-Woman Ratio by grid cell (roughly one square kilometer), 2020–2024, plotted on a common color scale. Greener cells have more children per working-age woman.
4. Notes: Youth-Woman Ratio by the average age of a neighborhood’s homes, pooled across twelve large metros and weighted by population. The pronounced 2000 hump flattens by 2020.
5. Notes: Percent change in the Youth-Woman Ratio, 2000–2020, by average home age. Both cities trough around 30-year-old housing; only Houston’s oldest neighborhoods recover.
6. A single owner in Boston who bought for $165,000 in the 1990s and watched the home appreciate $600,000 would owe roughly $70,000 in capital-gains tax on a sale (after the $250,000 exclusion, at combined federal and state rates) — a bill erased entirely by holding the home until death. In Houston or Atlanta, where appreciation has been milder relative to the exclusion, the same incentive is weak.
7. One alternative story — that the urban revival documented by Couture and Handbury, in which young professionals reclaim city cores, pushed families out — cannot account for the pattern. Gentrification hits the oldest central neighborhoods, yet the sharpest YWR declines fall on middle-aged 1990s suburbs, and the rebounds in some metros are inconsistent with displacement.
8. Georgia’s HB 581 (2024) caps annual assessed-value growth at inflation. Like Prop 13, it opens a widening wedge between assessed and market value that penalizes movers; unlike Prop 13, localities may opt out, and counties covering most of the state’s population have. See the Tax Foundation’s analysis: https://taxfoundation.org/blog/georgia-property-tax-reform/.


